Simplified scores to estimate risk of hospitalization and death among patients with COVID-19
Risk Scores; heatmap
Zipcode to med. income
Dr. Mora's Group
| ||
| ||
|
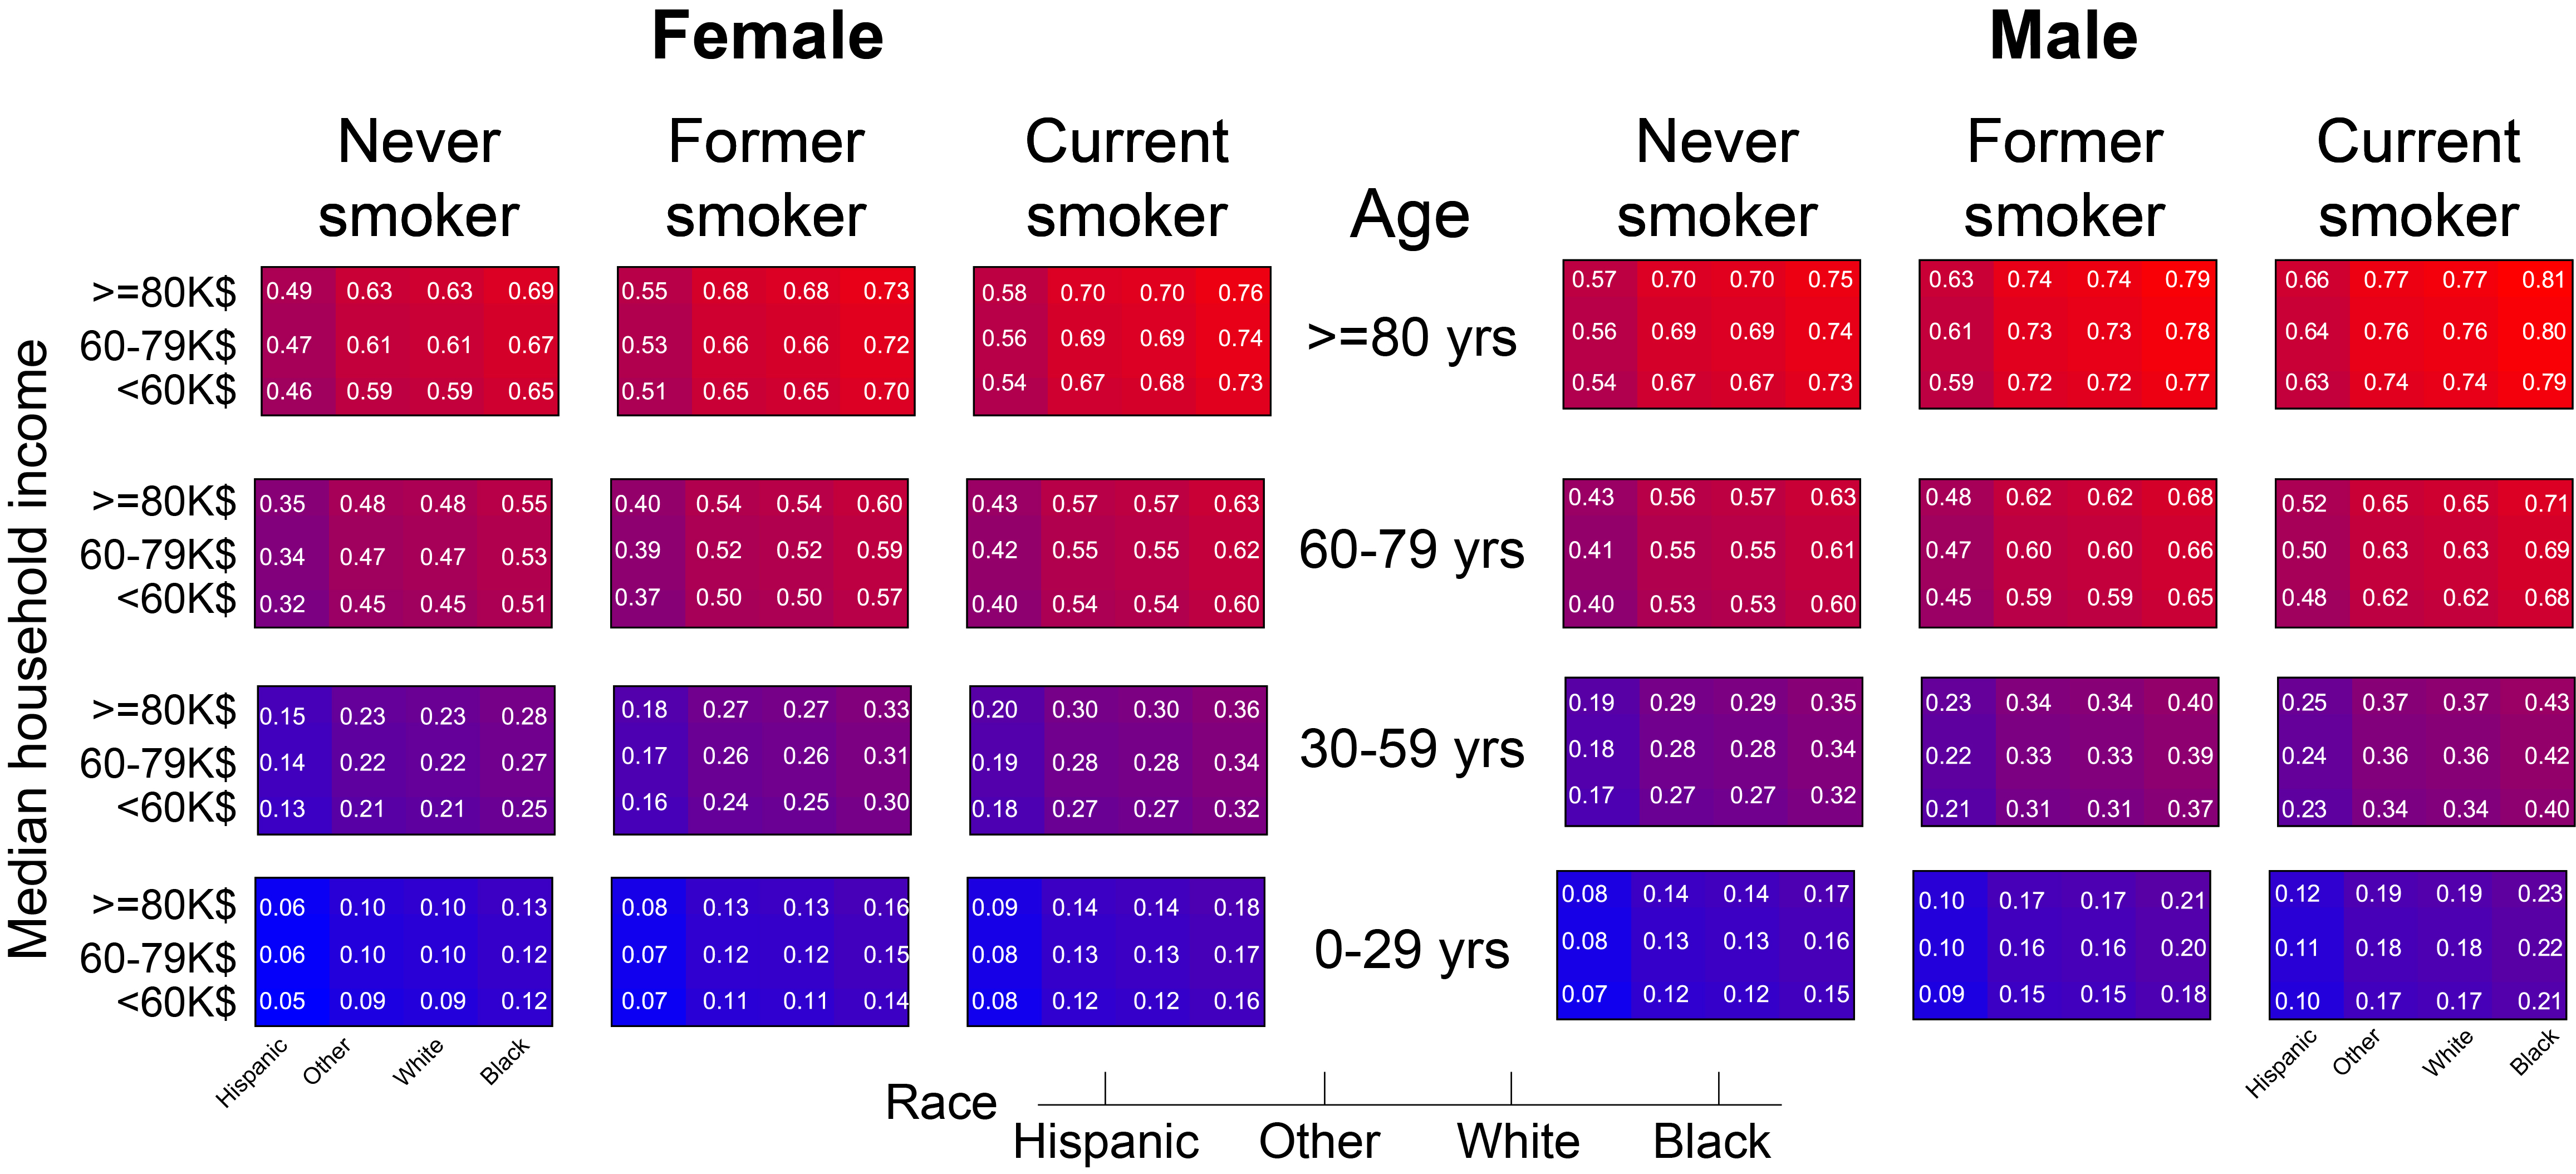
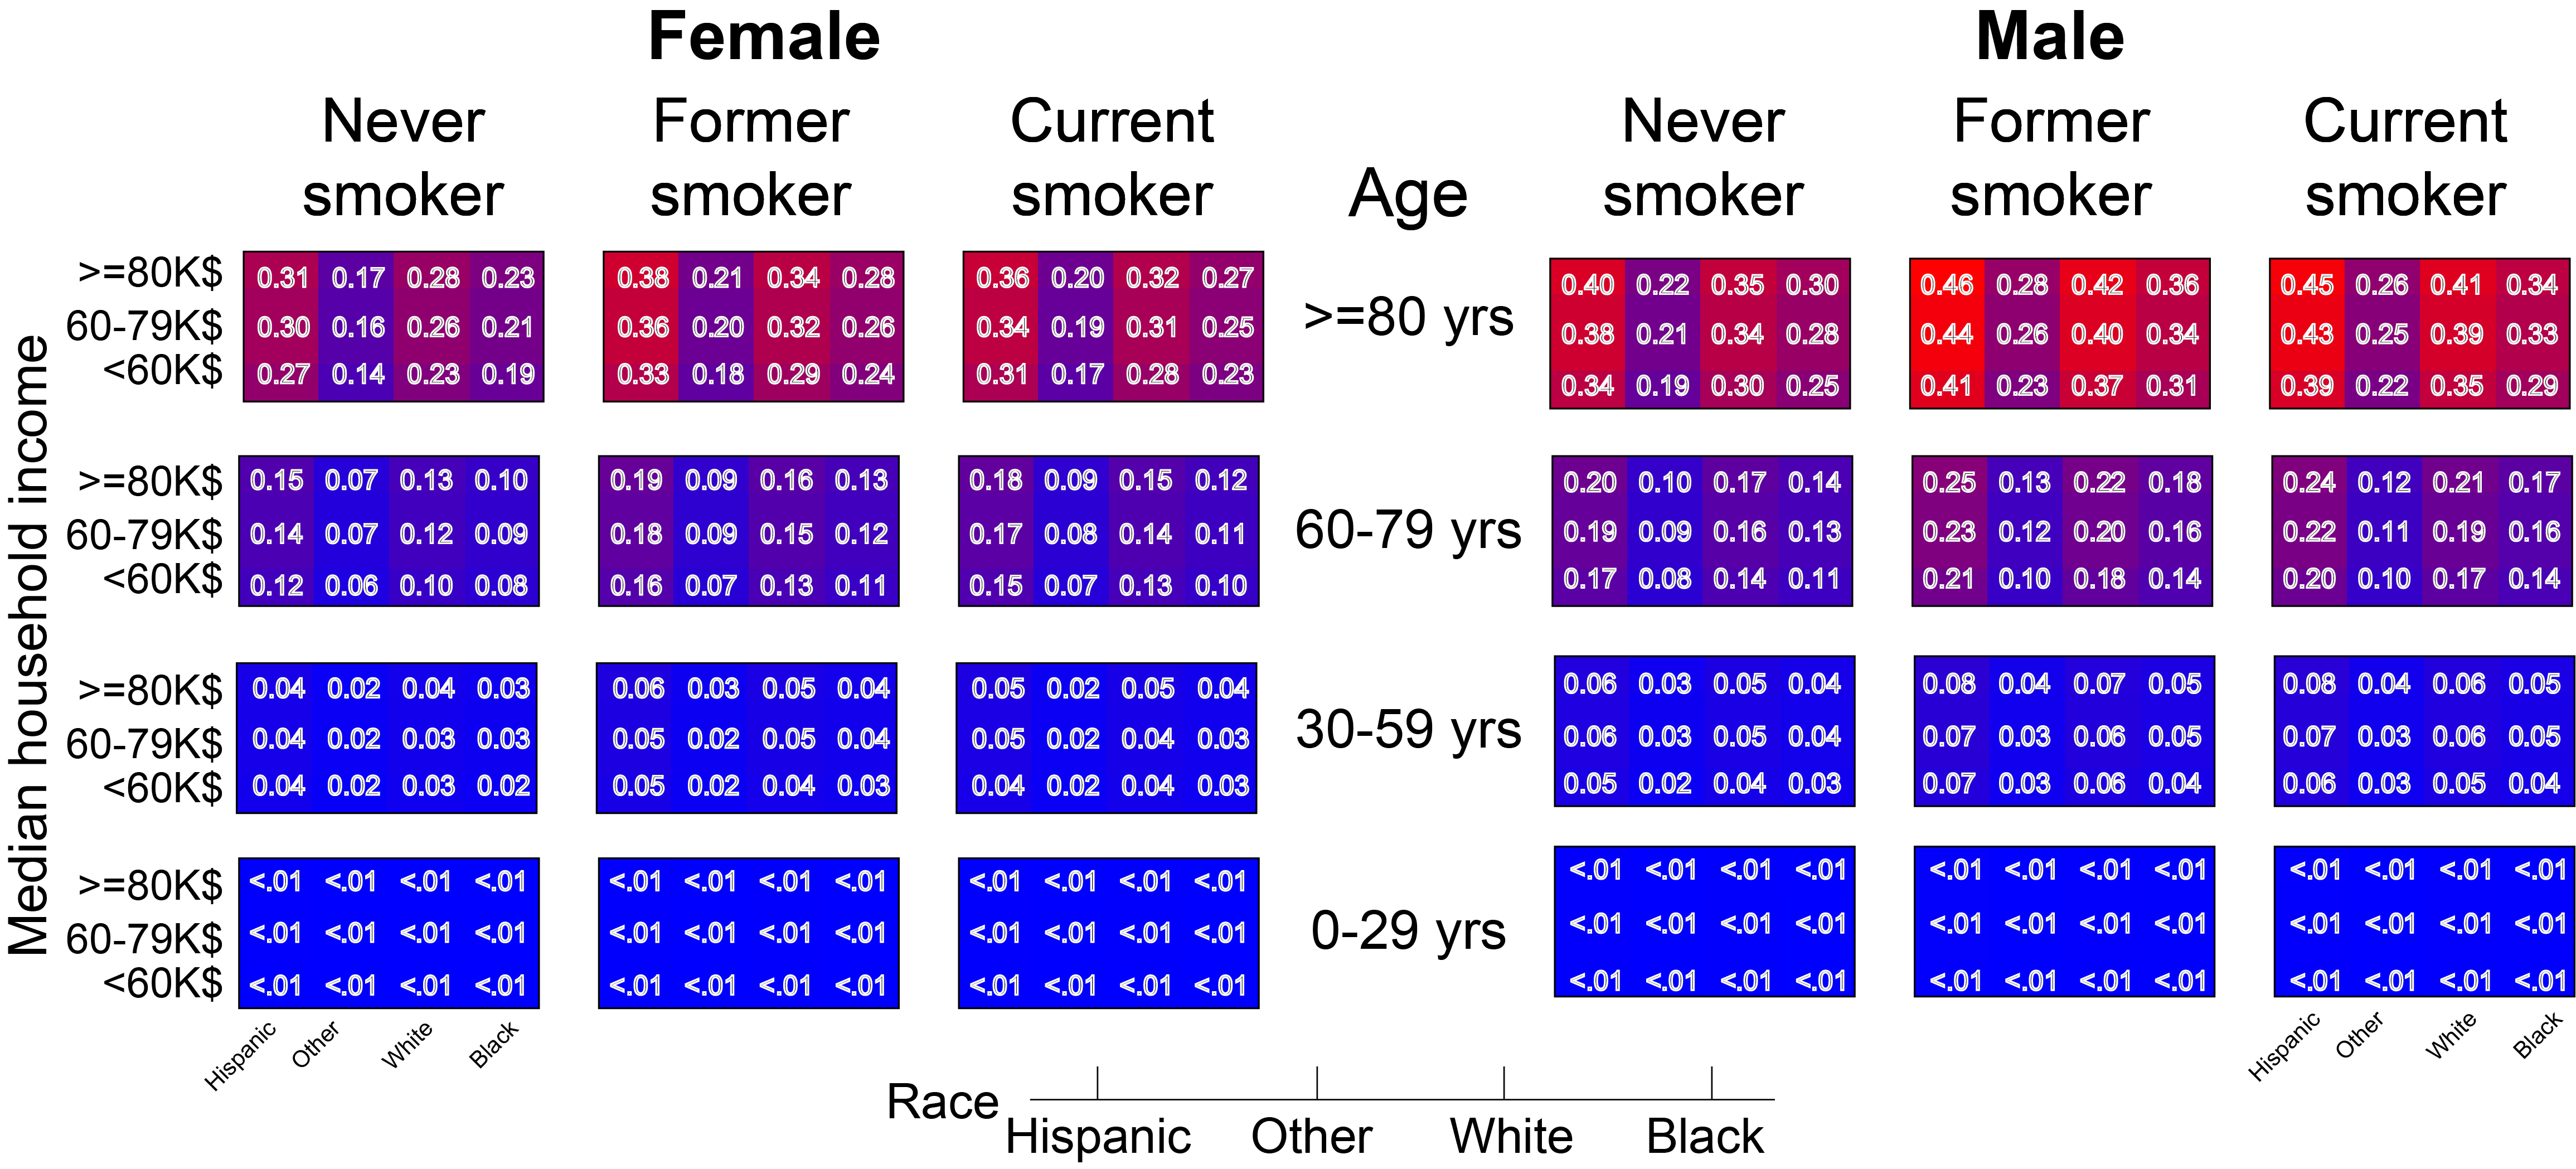
SARS2 scores heatmap for probabilities of hospitalization and mortality among hospitalized patients.
Probabilities are divided into female patients (left panel) and male patients (right panel).
The columns in each panel represent different smoking status.
Every row indicates an age category. Each matrix shows the three median household incomes in rows,
and columns of these matrices indicate four race/ethnic groups.
The cells are colored from light-blue (lowest probability) to dark red (highest probability). According to the US Census 2018, the lower median income cutoff ($60K) represents the lower 62% of the population, and the high-income cutoff ($80K) represents the top 15% of the population. |